Research Paper
The Age-Dependent Transcription Factor Snai2 Suppresses p53/p21-Dependent Cellular Senescence under VP-16-Induced DNA Damage
Authors
Sachi Sekine,1 Hirotoshi Kawata,2 Tomoko Kamiakito,2 Kentaro Tsuji,2 Takeo Nakaya,2 Keita Terui,1,* Shigeru Ono,1 Akira Tanaka2
1Department of Surgery, Division of Pediatric Surgery, Jichi Medical University, Tochigi, Japan
2Department of Pathology, Division of Human Pathology, Jichi Medical University, Tochigi, Japan
*Corresponding author: kta@cc.rim.or.jp
DOI:https://doi.org/10.59368/agingbio.20260045
Received: 11/10/2025, Revised: 4/24/2026, Accepted: 9/11/2026, Published: 10/16/2026
Full Article | PDF | Supplementary
Abstract
Studies on aging in the intestinal tract, which contributes to gut frailty, are limited. We aimed to screen proteins specifically expressed in the mouse intestinal tract during the neonatal period and to elucidate their functions. Murine adult fibroblast L929 cells and ICR mice were used for the study. Candidate proteins were screened by microarray analysis, and protein and mRNA expression were assessed by western blotting and reverse transcription-polymerase chain reaction, respectively. Moreover, cells and tissues from mice were subjected to histological analysis. Snai2 overexpression in adult-derived cells significantly suppressed senescence-associated β-galactosidase (SA-β-gal) activity under DNA damage conditions. Conversely, knockdown of Snai2 in fetus-derived cells exacerbated DNA damage-induced SA-β-gal activity and TRP53 expression, suggesting that SNAI2 functions to suppress cellular senescence in normal cells under DNA damage conditions.
Introduction
Frailty is defined as the decreased function of multiple physiological systems and increased vulnerability to stressors, resulting in increased mortality and probability of hospitalization, falls, and need of long-term care1. Frailty is one of the most serious global public health challenges of this century. The rapid increase in the aging population has resulted in a concomitant increase in the number of older adults with frailty, which subsequently places increased pressure on healthcare systems worldwide. Older adults with frailty exhibit an increased likelihood of unmet care needs, falls, fractures, hospitalization, lowered quality of life, iatrogenic complications, and early mortality. The increased risk of adverse outcomes can occur even in the absence of comorbidities. Therefore, effective strategies that target the prevention and management of frailty in the aging population will probably reduce the burden of the condition at both the individual and healthcare system levels2. At present, systematic syntheses of interventions to prevent or reduce frailty are unavailable; however, studies have reported reduced levels of frailty with appropriate interventions, and frailty is believed to be preventable3.
Bowel symptoms, including constipation and diarrhea, are common in the elderly population with frailty. However, these symptoms in older adults are neglected and are often undertreated in routine clinical practice4. Constipation is a key symptom of gut frailty. Individuals with constipation have significantly lower survival rates than those without. They are also at a higher risk of developing various diseases, such as chronic kidney disease, cardiovascular diseases, and neurodegenerative disorders, such as Parkinson’s disease5. “Gut frailty” is defined based on the “weakening” of gastrointestinal function. Recent studies revealed that gut frailty may exacerbate various diseases, cause chronic inflammation, and serve as a precursor of frailty5.
Aging of the intestinal tract has recently attracted attention as a central organ-level process that contributes to systemic aging. The intestine is one of the most rapidly renewing organs in the body, and its aging leads to impaired barrier function, dysbiosis, and chronic inflammation, which, in turn, accelerate organismal aging6. Although studies on the intestinal tract and intestinal bacteria have been conducted, studies on aging in the intestinal tract itself are limited. The neonatal period is considered the opposite of aging, and characterization of neonatal cells may contribute to our knowledge of aging7.
Therefore, the purpose of this study was to screen for proteins specifically expressed in the mouse intestinal tract during the neonatal period and elucidate their functions. We focused on snail family transcriptional repressor 2 (SNAI2) and investigated its antiaging effect in non-tumor cells.
Materials and Methods
Cells
Murine adult fibroblast L929 cells were purchased from Japanese Collection of Research Bioresources (Osaka, Japan) and maintained in Eagle minimum essential medium (MEM) supplemented with 10% fetal bovine serum (FBS) and minimum essential amino acids. The murine fetal fibroblast line NIH3T3 was cultured in Dulbecco’s MEM supplemented with 10% FBS, as previously described8. L929 cells and NIH3T3 cells are used in studies of cellular senescence, apoptosis, and DNA damage response. We used them in this experiment because L929 cells were not found to express Snai2 at the steady state, but NIH3T3 cells expressed it9,10.
Animals
ICR mice were purchased from SLC (Shizuoka, Japan). Histological specimens were prepared from neonates on days 1, 3, and 9 after birth and from 10-week-old mice of both sexes. Animal experiments were approved by the Animal Ethical Committee of Jichi Medical University (20138-01). All the experiments were performed and reported in accordance with the ARRIVE guidelines 2.0.
Plasmids
Full-length murine Snai2 cDNA was prepared via reverse transcription-polymerase chain reaction (RT-PCR) using total RNA from NIH3T3 cells and inserted into the pcDNA 3.1 expression vector (Invitrogen, Carlsbad, CA, USA).
Preparation of RNA and cDNA
RNA samples for oligonucleotide microarray analysis were obtained from the colon of postnatal day 1, 10-week-old, and more than 30-week-old mice of both sexes using TRI reagent (Molecular Research Center, Cincinnati, OH, USA). cDNA was prepared from the extracted RNA using the Oligo(dT)15 Primer (Promega, Madison, WI, USA) and SuperScript III (Thermo Fisher Scientific, Waltham, MA, USA).
Protein extraction and quantification
Proteins were isolated from various organs using TRI reagent. Cultured cells were derived from cell lysates using CelLytic M Cell Lysis Reagent (Sigma-Aldrich, St. Louis, MO, USA). Protein quantification was performed using the Pierce BCA Protein Assay Kit (Thermo Fisher Scientific).
Histological specimens
Histological specimens were prepared from the colon, brain, heart, and lung of neonates and adults of both sexes using routine formalin fixation and paraffin embedding.
Oligonucleotide microarrays
RNA from colons of neonatal and adult mice of both sexes was analyzed using a SurePrint G3 Mouse microarray (Agilent Technologies, Tokyo, Japan) and consigned to TAKARA Bio (Shiga, Japan). The data obtained were normalized using the Agilent Feature Extraction software (Agilent Technologies). Hierarchical analysis was performed using AquaClustering software. Neonatally upregulated genes were extracted from mice of both sexes. Ten genes were analyzed using conventional PCR. The expression of insulin-like growth factor 2 mRNA-binding protein 3 (Igf2bp3), snai2, glypican 3 (Gpc3), protein delta homolog 1 (Dlk1), and baculoviral IAP repeat containing 5 (Birc5) was validated using immunohistochemistry and western blotting.
RT-PCR
RT-PCR of 1 μg of extracted cDNA was performed using Premix Taq (TAKARA Bio, Shiga, Japan) with each gene-specific primer listed in Table S1. The thermocycling parameters were 94°C for 3 min followed by 35 cycles of 94°C (45 sec), 55°C (30 sec), 72°C (90 sec), and 72°C (10 sec). PCR products were separated on a 2% agarose gel and stained with ethidium bromide to detect bands. Expression was also confirmed using glyceraldehyde 3-phosphate dehydrogenase (Gapdh) as an internal control.
Immunohistochemistry
Formalin-fixed and paraffin-embedded sections were pretreated in an autoclave at 121°C for 5 min. The pretreated sections were incubated with primary antibodies at 4°C overnight. The tissues were treated with Envision (DAKO JAPAN, Tokyo, Japan) and stained with 3,3′-diaminobenzidine. Table S2 lists the antibodies and methods used to detect the antigens.
Western blotting
Briefly, 15 or 20 μg of proteins was resolved via sodium dodecyl sulfate-polyacrylamide gel electrophoresis and transferred to a polyvinylidene difluoride membrane (Merck, Darmstadt, Germany). The blotting membrane was incubated with primary antibodies (Table S3), followed by incubation with horseradish peroxidase-conjugated secondary antibodies (DAKO A/S, Glostup, Denmark). Protein bands were visualized using an enhanced chemiluminescence detection system (GE Healthcare, Buckinghamshire, United Kingdom). The same membrane was stripped and re-probed with anti-GAPDH antibodies.
siRNA transfection
Small interfering RNA (siRNA) against mouse Snai2 and scrambled siRNAs were purchased from Life Technologies (Tokyo, Japan). The siRNA sequences used are listed in Table S4. The siRNA was added at a final concentration of 40 nM. Three types of siRNAs were purchased, of which two with good transfection efficiency were used for suppression experiments. To investigate the effect of Snai2 depletion, NIH3T3 cells were plated in a 60-mm dish (2 × 10⁵ cells/dish) in phenol red-free RPMI 1640 medium. The following day, the cells were treated with either scrambled siRNA or siRNAs against Snai2 (40 nM). After 5 hours of incubation, the medium was replaced with medium containing VP-16 (10 μM) or not. The next day (day 2), the medium was replaced with RPMI 1640 medium. After another 48 hours of incubation, cell lysates were extracted using the CelLytic M Cell Lysis Reagent. Since ionizing radiation, chemotherapy, genotoxic stress, and oxidative stress are known to cause DNA damage and subsequent cellular senescence, cellular senescence experiments were performed after treatment with VP-1611.
Gene transfer
L929 cells were seeded in a 60-mm dish (2×10⁴ cells/dish) in phenol red-free RPMI 1640 medium supplemented with dextran-coated charcoal-treated 10% FBS. The next day (day 1), expression plasmids (4.0 μg/dish) were transfected into cells using Opti-MEM and Lipofectamine reagent (Lipofectamine 3000; 7.5 μl/dish, 2 μl per μg of P3000 reagent DNA). After 5 hours of incubation, the medium was replaced with medium containing VP-16 (10 μM) or without it. The next day (day 2), the medium was replaced with RPMI 1640 medium. After another 48 hours of incubation, cell lysates were extracted using the CelLytic M Cell Lysis Reagent.
Senescence-associated beta-galactosidase (SA-β-gal) assay
L929 and NIH3T3 cells (3×10⁴ cells/well) were plated in a four-well chamber slide and transfected with siRNAs (40 nM) using Lipofectamine reagent (Life Technologies Japan) for 48 hours, following which the chamber slide was fixed with 4% formaldehyde solution. SA-β-gal staining was performed using a senescence detection kit (BioVision, Mountain View, CA, USA) as previously described12.
Statistical analysis
Statistical analyses were performed using Statcel4 (Statcel—the useful add-in forms on excel—4th ed.) software (OMS, Tokyo, Japan). For comparisons among the three groups, the Kruskal–Wallis test was used first; if a significant difference was found, multiple comparisons were performed using the Steel–Dwass method for all combinations of two groups each. Values of p < 0.05 were considered significant.
Results
Microarray analysis
First, to determine the genes that characterize the neonatal period, oligonucleotide microarrays were performed to select candidate genes, mainly those related to development and metabolism; furthermore, the expression of these genes was evaluated using multiple methods. Microarrays were performed using colon tissues from neonatal and mature male and female mice (Tables S5 and S6). Paired microarray data between samples of both sexes were found to be very similar based on hierarchical cluster analysis. However, results of hierarchical cluster analysis between the neonatal and mature stages were relatively different, confirming the low technical error associated with this microarray.
Screening of candidate genes
Among the genes predominantly expressed in the neonatal colon tissues identified in the microarray results, we selected 10 genes that are involved in development and transcription and whose relationship with the neonatal period is not yet fully understood (
| Genes Predominant in Neonatal ♂ Mice | Genes Predominant in Neonatal ♀ Mice | ||||||
|---|---|---|---|---|---|---|---|
| Gene symbol | GenBank accession | Log ratio | Gene symbol | GenBank accession | Log ratio | ||
| 1 | Igf2bp3 | NM_023670 | −6.77751813 | 1 | Mamdc4 | NM_001081199 | −8.958082808 |
| 2 | Mdk | NM_010784 | −5.850866099 | 2 | Apoa4 | NM_007468 | −6.333896522 |
| 3 | Plagl1 | NM_001364645 | −5.617425548 | 3 | Dlk1 | NM_010052 | −6.0441526 |
| 4 | Egr1 | NM_007913 | −5.421855032 | 4 | Mttp | NM_001355052 | −6.023572151 |
| 5 | Dlk1 | NM_010052 | −5.19541733 | 5 | St3gal1 | NM_009177 | −5.993198939 |
| 6 | Cartpt | NM_013732 | −5.128672765 | 6 | Igf2 | NM_010514 | −5.865863964 |
| 7 | Ly6h | NM_011837 | −5.121512705 | 7 | S100g | NM_009789 | −5.650361178 |
| 8 | Nrep | NM_053078 | −5.021527185 | 8 | Npl | NM_028749 | −5.620906272 |
| 9 | Ly6h | NM_011837 | −4.985104335 | 9 | Tmigd1 | NM_025655 | −5.564327752 |
| 10 | Mdk | NM_010784 | −4.97664506 | 10 | Bcl2l15 | NM_001142959 | −5.393713034 |
| 11 | Ly6h | NM_011837 | −4.966967902 | 11 | Nrep | NM_053078 | −5.386441415 |
| 12 | Mfap2 | NM_008546 | −4.905876675 | 12 | Mdk | NM_010784 | −5.264294848 |
| 13 | Igf2 | NM_010514 | −4.892721321 | 13 | Tlr3 | NM_126166 | −5.210564585 |
| 14 | S100g | NM_009789 | −4.869884851 | 14 | Slc7a9 | NM_021291 | −5.209199361 |
| 15 | Slc51a | AK147155 | −4.847812648 | 15 | Ms4a10 | NM_023529 | −5.119452782 |
| 31 | Dlk1 | NM_010052 | −4.47041156 | 71 | Gpc3 | NM_016697 | −3.78531012 |
| 93 | Gpc3 | NM_016697 | −3.39957777 | 139 | Snai2 | NM_011415 | −3.01039988 |
| 104 | Birc5 | NM_009689 | −3.30281718 | 242 | Gli1 | NM_010296 | −2.72687043 |
| 294 | Gli1 | NM_010296 | −2.72561052 | 298 | Gdnf | NM_010275 | −2.57673894 |
| 304 | Gli3 | NM_008130 | −2.70700428 | 337 | Gli3 | NM_008130 | −2.47413659 |
| 349 | Snai2 | NM_011415 | −2.61332963 | 364 | Igf2bp2 | NM_183029 | −2.41902514 |
| Igf2bp3, insulin-like growth factor 2 mRNA-binding protein 3; Snai2, snail family transcriptional repressor 2; Dlk1, protein delta homolog 1; Gpc3, glypican 3; Birc5, baculoviral IAP repeat containing 5; Gapdh, glyceraldehyde 3-phosphate dehydrogenase. Genes presented in bold font represent those selected in this study. | |||||||
Western blotting showed that IGF2BP3, SNAI2, and BIRC5 were strongly expressed in neonatal colon tissues, whereas GPC3 and DLK1 were weakly expressed in both neonatal and mature colon tissues, with no significant differences (
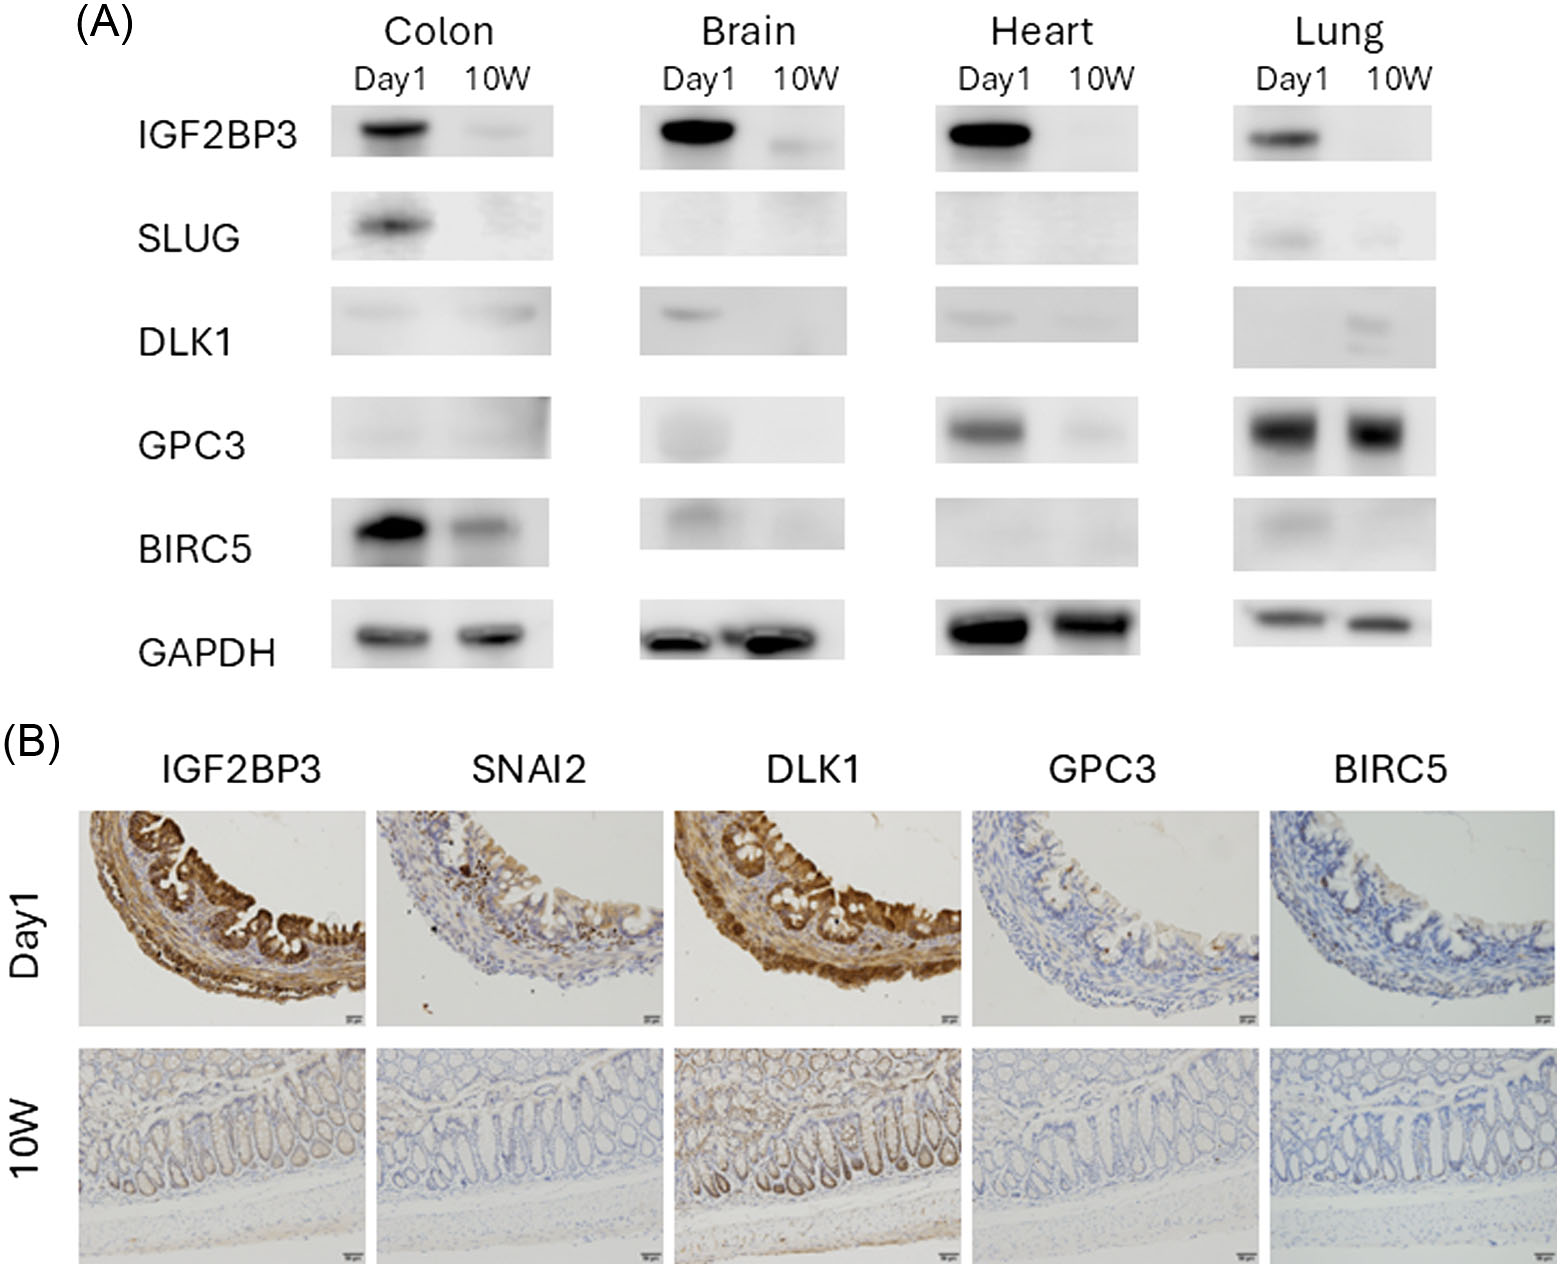
(A) Western blot results for neonatal and mature mice. Western blot results for IGF2BP3, SNAI2, DLK1, GPC3, and BIRC5 in colon tissues, brain, heart, and lungs of neonatal (day 1) and mature mice. IGF2BP3 and SNAI2 are strongly expressed in neonatal colon tissues. Strong expression of IGF2BP3 was also observed in other organs during the neonatal period. IGF2BP3, insulin-like growth factor 2 mRNA-binding protein 3; SNAI2, snail family transcriptional repressor 2; DLK1, protein delta homolog 1; GPC3, glypican 3; BIRC5, baculoviral IAP repeat containing 5; GAPDH, glyceraldehyde 3-phosphate dehydrogenase; 10W, mice after 10 weeks. (B) Immunohistochemical analysis. The results of immunohistochemical analyses of each candidate gene in colon tissues of neonatal (day 1) and mature mice are shown. IGF2BP3 and DLK1 are ubiquitously expressed in neonatal tissues, whereas SNAI2 is primarily expressed in the stromal tissues. IGF2BP3, insulin-like growth factor 2 mRNA-binding protein 3; SNAI2, snail family transcriptional repressor 2; DLK1, protein delta homolog 1; GPC3, glypican 3; BIRC5, baculoviral IAP repeat containing 5; 10W, mice after 10 weeks
Effect of Snai2 overexpression
Since a simple method to evaluate the characteristics of immature and juvenile cells was unavailable, we divided L929 cells into two groups treated with and without VP-16, an anticancer drug that causes DNA damage, with the target gene introduced, and evaluated how the induced cellular senescence was altered. We determined SA-β-gal activity, which is a common and simple indicator of cellular senescence, as the evaluation method. First, we confirmed that Snai2 expression was weak in L929 cells at steady state and that transfection with each plasmid increased gene expression (Fig. S1). For SA-β-gal activity, statistical analysis was performed on the positivity rate of SA-β-gal activity in the control group transfected with an empty vector (control) and the group transfected with Snai2, with or without VP-16 treatment. Although there was no significant difference between the two groups without VP-16 treatment, multiple comparisons between the two groups using the Steel–Dwass method showed that there was a difference in the positivity rate of SA-β-gal activity between the control and Snai2 groups under VP-16 administration, which was significant. Therefore, Snai2 expression significantly reduced the SA-β-gal activity induced by VP-16 compared to that in the control (
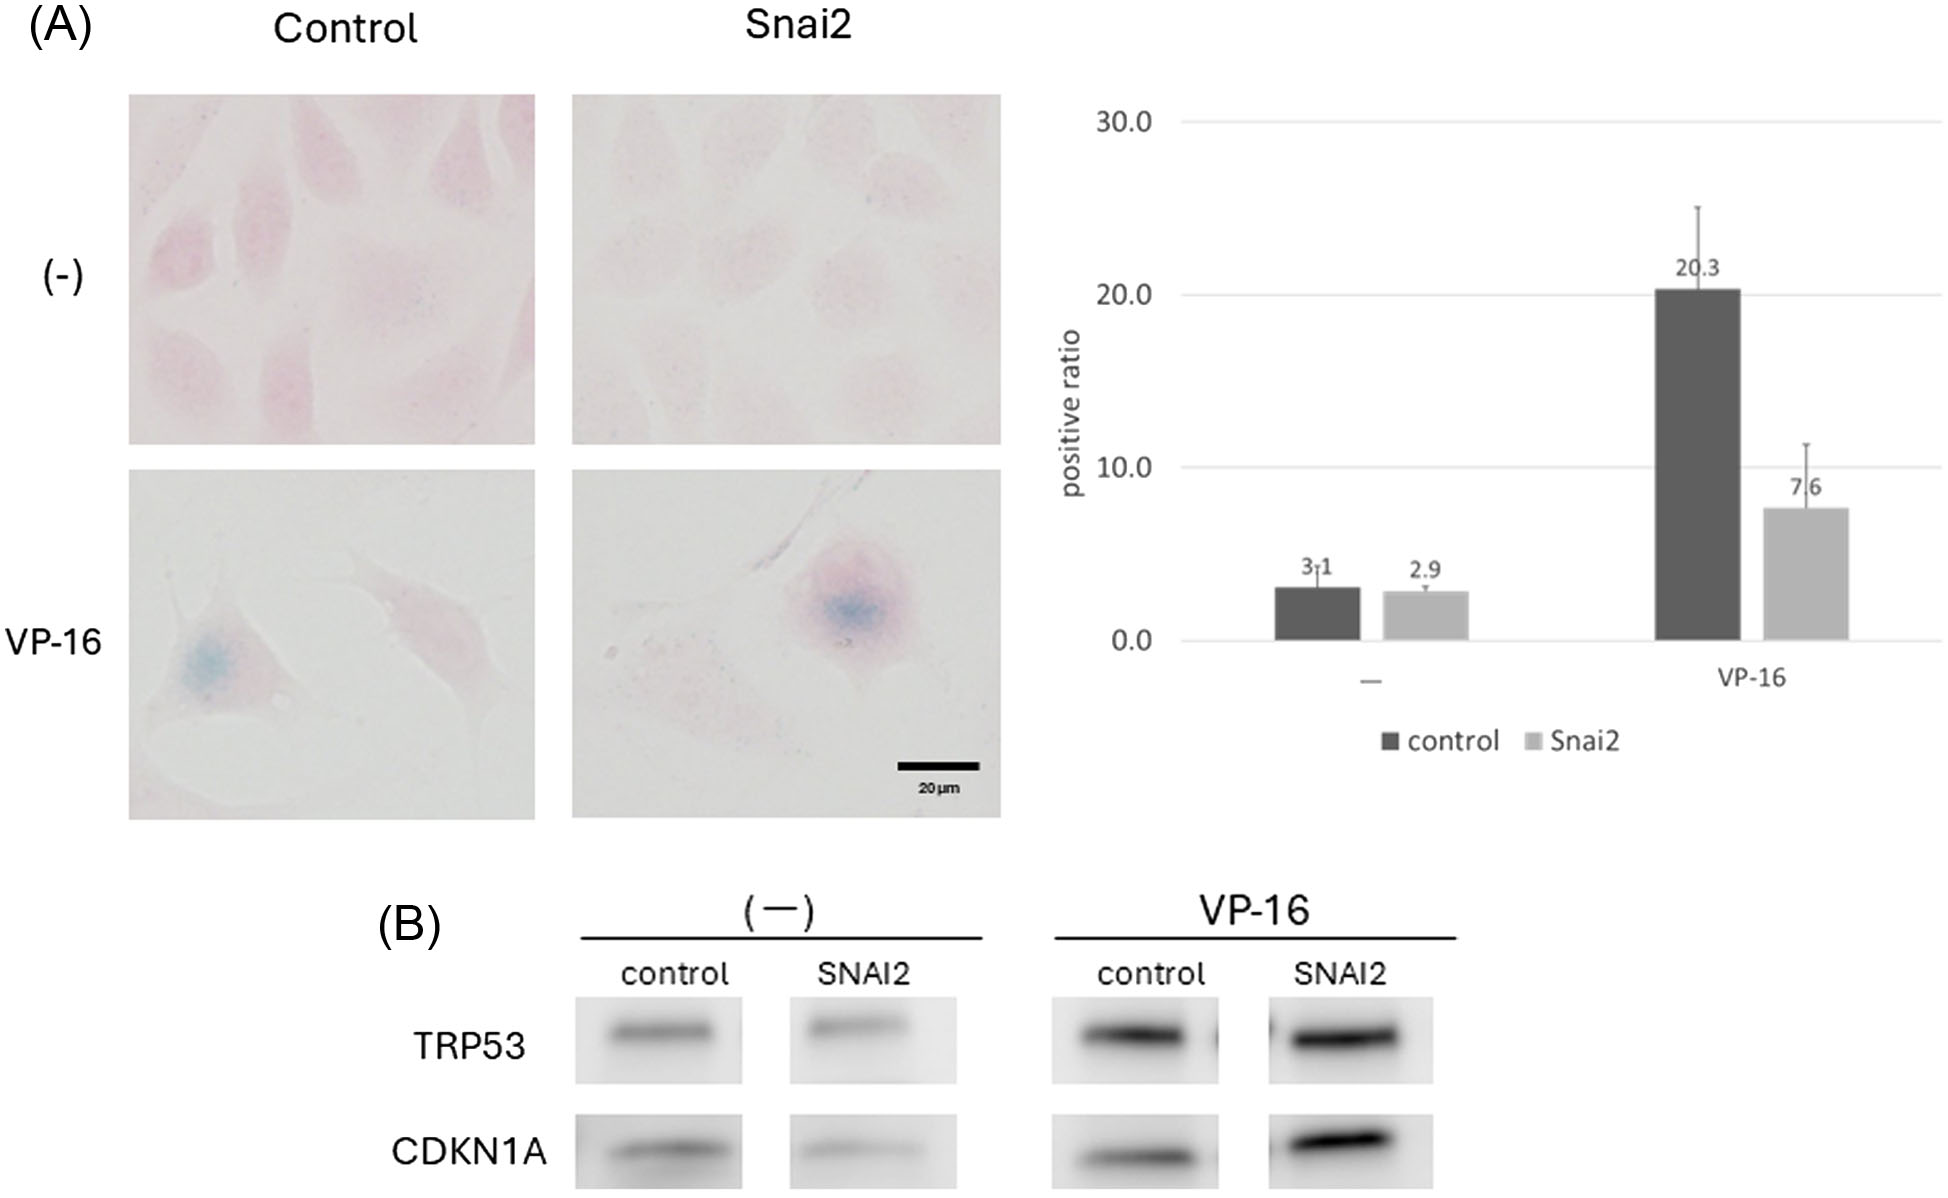
(A) SA-β-gal activity in L929 cells transfected with Snai2 with and without VP-16 treatment. The image of SA-β-gal-stained cells (40×) is shown on the left, and the graph representing the proportion of positive SA-β-gal activity is shown on the right (* p < 0.05). Snai2 expression significantly reduced SA-β-gal activity induced by VP-16. Snai2, snail family transcriptional repressor 2; SA-β-gal, senescence-associated β-galactosidase activity; VP-16, 10 μM VP-16 treatment; (-), no VP-16 treatment. (B) Western blot results in L929 cells. TRP53 and CDKN1A levels are shown on the right for the group treated with VP-16 and on the left for the group without VP-16 treatment. TRP53 and CDKN1A levels were increased under VP-16 treatment. The expression levels of TRP53 and CDKN1A were attenuated only in Snai2-overexpressing cells in the group without VP-16 treatment. No changes were observed after VP-16 treatment. Snai2, snail family transcriptional repressor 2; VP-16, 10 μM VP-16 treatment; (-), no VP-16 treatment
Next, we evaluated the p53/p21 pathway, which is involved in cell cycle arrest as a hallmark of cellular senescence, and compared the protein expression levels of p53 (encoded by Trp53) and its target gene, p21 (Cdkn1a), in Snai2-overexpressing cells via western blotting. In Snai2-overexpressing cells, the expression levels of TRP53 and CDKN1A were slightly decreased in steady-state cells without VP-16 treatment compared to those in control cells; however, no inhibitory effect on cellular senescence was observed with VP-16 treatment (
Response after DNA damage under Snai2 repression
Next, we evaluated the siRNA-mediated suppression of each gene in NIH3T3 cells, in which Snai2 was expressed at a steady state, and evaluated the response after DNA damage induced by VP-16 as well as forced expression in L929 cells. The reduction in the expression of each gene following siRNA-mediated knockdown was confirmed by western blotting (Fig. S2).
First, NIH3T3 cells were transfected with Snai2 siRNA, and SA-β-gal activity was compared between the VP-16-treated and untreated groups. As in the overexpression experiment, statistical analysis was performed, and the Kruskal–Wallis test showed a significant difference in activity among the control, Snai2 #1 siRNA, and Snai2 #3 siRNA in VP-16-treated cells, while the Steel–Dwass test showed a significant difference in activity between the control and Snai2 #3 siRNA in VP-16-treated cells. Snai2 #3 siRNA transfection significantly enhanced SA-β-gal activity in NIH3T3 cells under VP-16 treatment (
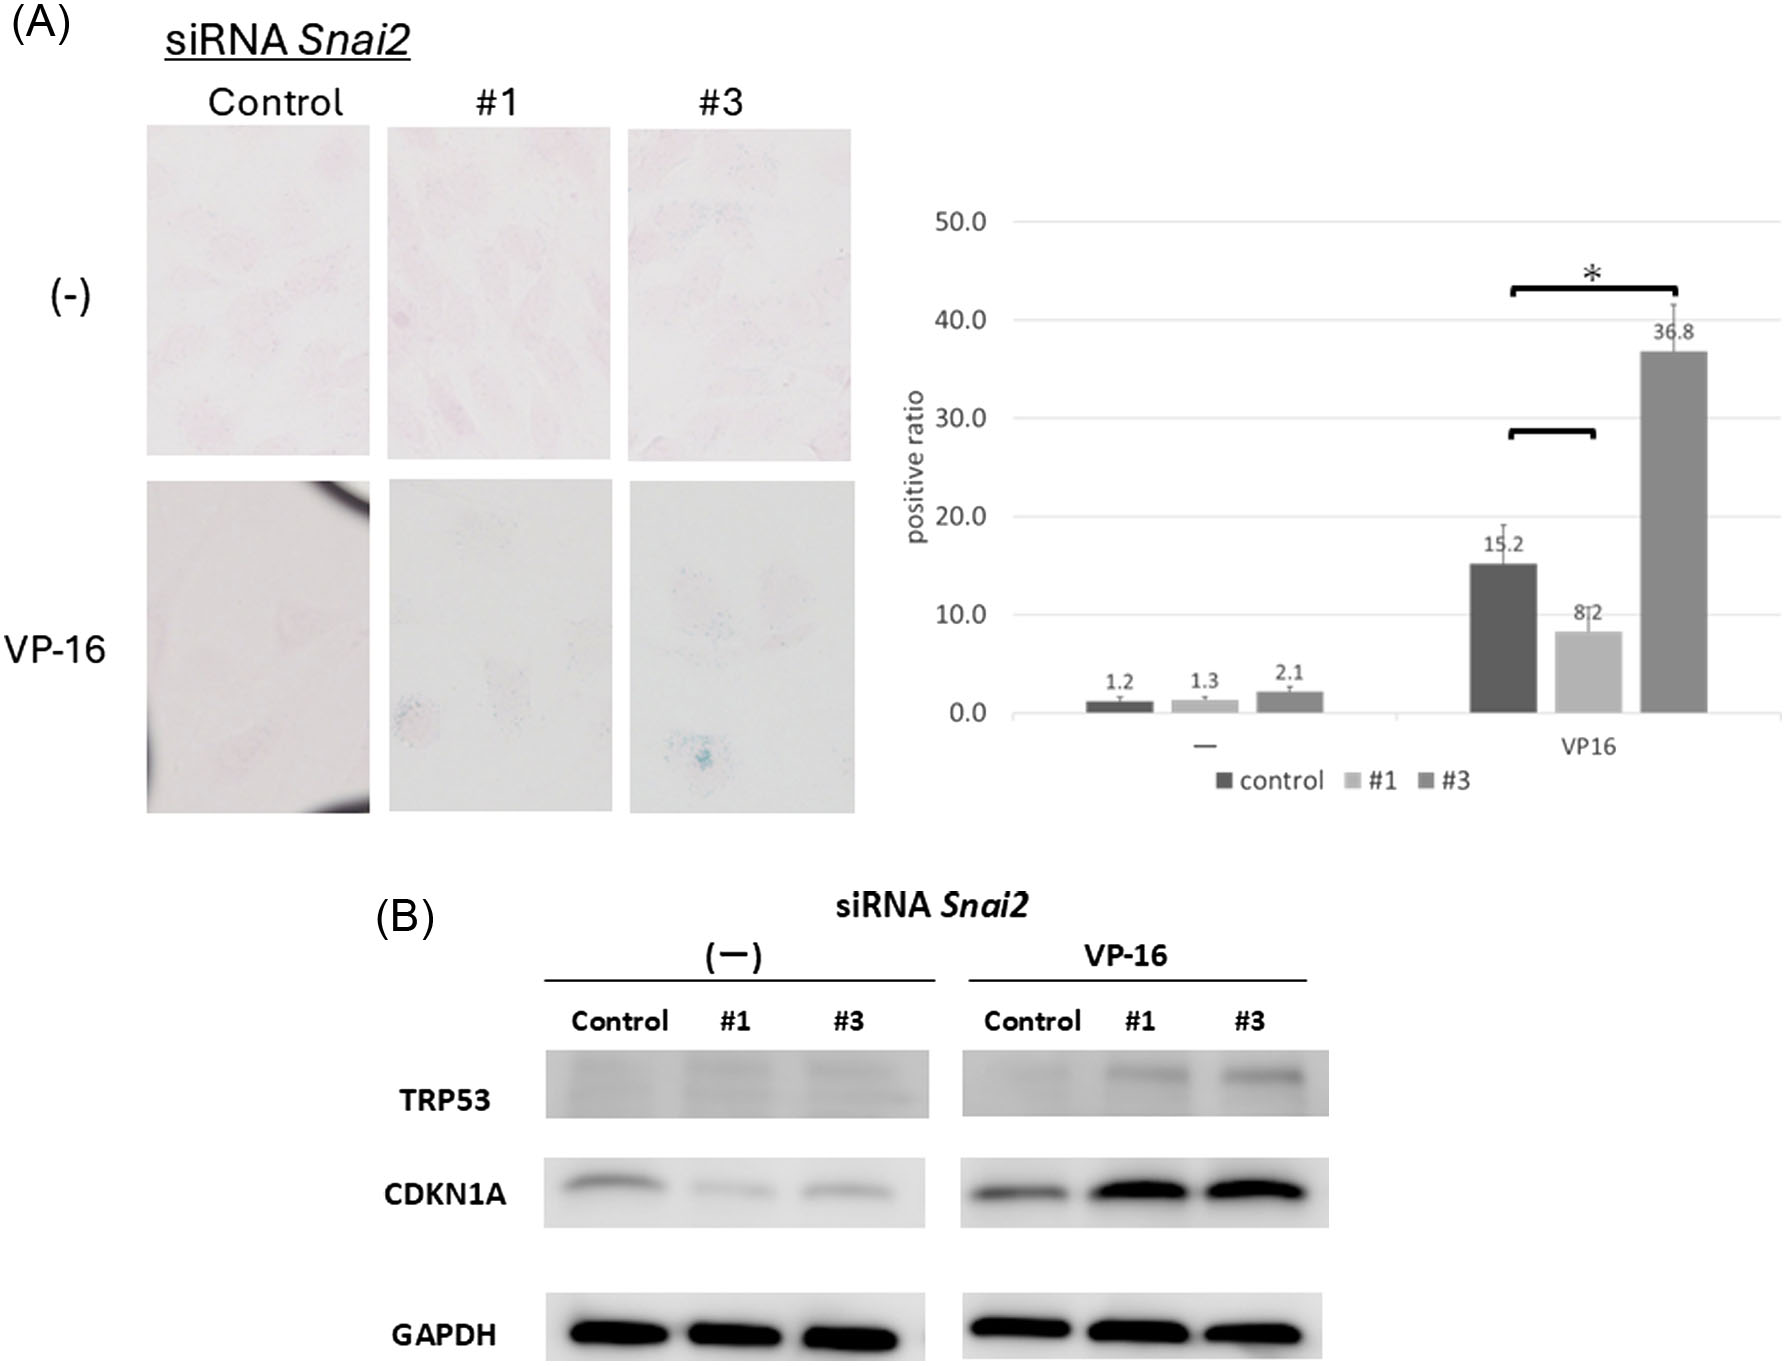
(A) SA-β-gal activity in Snai2 siRNA-mediated knockdown of NIH3T3 cells under VP-16 treatment and in the untreated group. Snai2 #3 siRNA significantly enhanced SA-β-gal activity induced by VP-16; * p < 0.05. Snai2, snail family transcriptional repressor 2; SA-β-gal, senescence-associated β-galactosidase activity; VP-16, 10 μM VP-16 treatment; (-), no VP-16 treatment. (B) Western blot results in NIH3T3 cells after target gene knockdown by siRNA. In NIH3T3 cells, scrambled siRNAs (control) and Snai2 siRNAs were transfected, and the medium was replaced with either medium containing VP-16 or without it. Proteins were collected after incubation and subjected to western blot analysis. GAPDH was used as a loading control. The expression of TRP53 and CDKN1A was enhanced in VP-16-treated cells compared to that in control cells transfected with Snai2 siRNA. Snai2, snail family transcriptional repressor 2; GAPDH, glyceraldehyde 3-phosphate dehydrogenase; VP-16, 10 μM VP-16 treatment; (-), no VP-16 treatment.
TRP53 and CDKN1A expression was evaluated via western blotting; downregulation of Snai2 failed to induce TRP53 and CDKN1A expression in the VP-16 untreated group (
Discussion
In this study, genes specific to the neonatal period were identified by performing oligonucleotide microarrays to select candidate genes related to development and metabolism that were preferentially expressed during the neonatal period. The expression of these genes was further confirmed by PCR, western blotting, and immunohistochemistry. In particular, we focused on Snai2 because it was preferentially expressed in the colon during the neonatal period. Using an open database (Evo-devo mammalian organs. https://apps.kaessmannlab.org/evodevoapp/), we confirmed that Snai2 was highly expressed during embryonic development and its expression decreased immediately after birth in humans and mice.
SNAI2 is a known inhibitory transcription factor classified as a C2H2-type zinc finger protein involved in the formation of the neural crest via epithelial-mesenchymal transition (EMT) during early embryogenesis. Furthermore, it is involved in the EMT process in tumors and in the maintenance of cancer stem cells in breast cancer, and it is well studied in developmental and tumor biology. Recently, SNAI2 was shown to be involved in a wide range of biological processes, including tumor metastasis, stem and progenitor cell biology, cell differentiation, vascular remodeling, and DNA damage repair13; however, the function in infantile and neonatal cells has not been fully analyzed. Therefore, we further analyzed Snai2 in this study.
Functional analysis of Snai2 was performed by evaluating the changes under overexpression and repression. No changes were observed under steady-state conditions; however, major differences were observed under DNA damage conditions compared with those under steady-state conditions. Overexpression in adult-derived cells showed a significant difference in suppression of SA-β-gal activity under DNA damage induction; however, no clear mechanism was identified for TRP53 activity. In contrast, inhibition in fetus-derived cells enhanced SA-β-gal activity and TRP53 expression under DNA damage induction. This suggests that SNAI2 may suppress cellular senescence by suppressing the TRP53 response.
Recently, several studies have suggested a link between SNAI2 and aging. Snai2 is downregulated in both radiation-damaged and senescent cells14. In breast and lung cancer, hRAD9 promotes p21-dependent senescence and regulates tumorigenesis by downregulating Snai215. In stem cells, Snai2 is involved in cellular senescence, and its downregulation promotes stem cell senescence16,17. While most of these studies have focused on stem and cancer cells, our study showed that Snai2 is also associated with senescence in normal cells under conditions of DNA damage.
This study has several limitations. First, although many methods can assess cellular senescence, we used the p53-p21 pathway and SA-β-Gal assay, which are considered the most reliable and important methods. Second, we only evaluated fibroblasts in the assay because immunohistochemistry showed that Snai2 was highly expressed in the stroma but not in the epithelium.
Conclusion
Snai2, which was highly expressed in the colon during the neonatal period, may inhibit senescence in non-tumor cells. This finding may be useful in developing treatments for gut frailty in the future. However, further studies are required to elucidate the underlying mechanisms.
Funding Statement
This work was supported, in part, by a grant from the Community Health Science Laboratory (21CHS9905003).
Author Contributions
S.S. wrote the manuscript and prepared the figures and tables. T.K. assisted with the experiments. A.T. and K.T. supervised the study. H.K., K.T., T.N., and S.O. reviewed the manuscript.
Conflict of Interest
The authors have no conflicts of interest to report.
Data Availability Statement
All data generated or analyzed during this study are included in this published article (and its Supplementary Information files).
Supplementary Materials
Supplemental information can be found here: Supplementary.